Section 1 – Industry-wide data
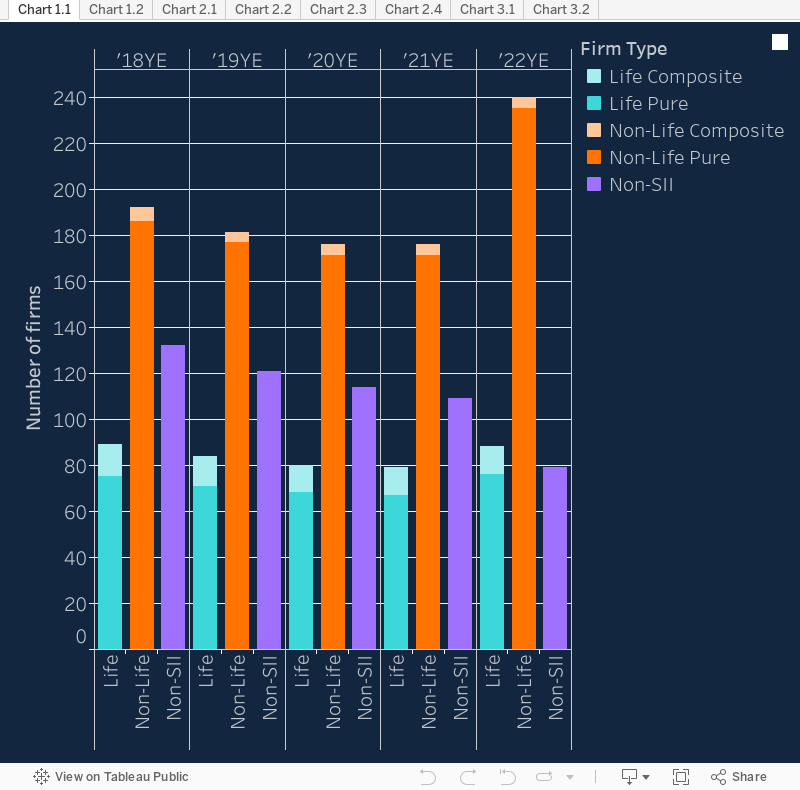
Chart 1.1 – Firm Count
This chart shows the total number of authorised insurance firms in the UK, split between those which submit UK Solvency II QRTs and those that do not. The UK Solvency II firms are further categorised into Life and Non-life firms, where composite firms, as detailed in the Annex above, are grouped as Life or Non-life based on their primary business.
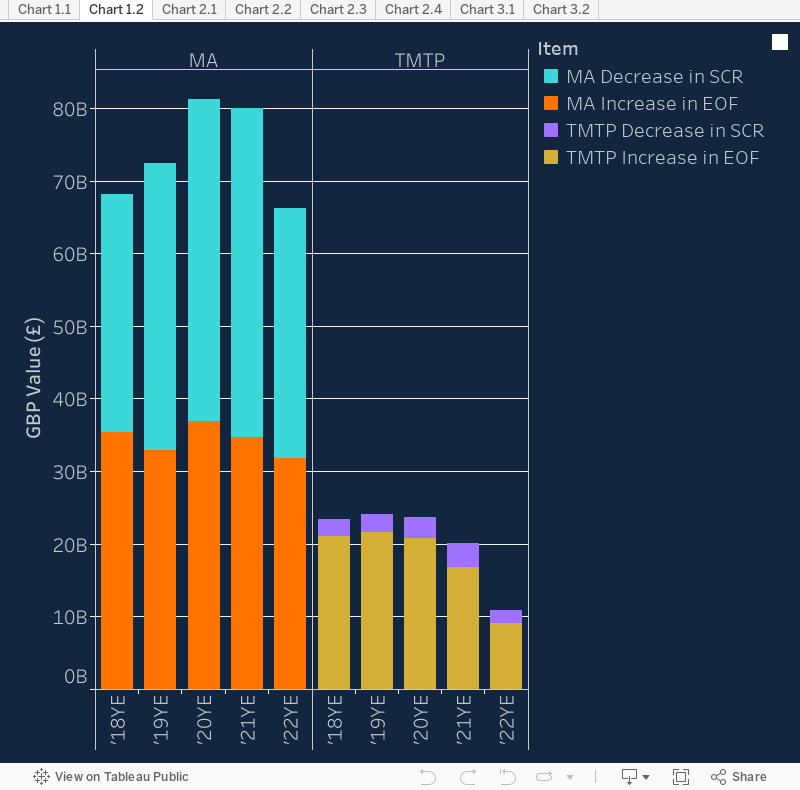
Chart 1.2 – Transitional measure on technical provisions & matching adjustments
This chart shows the impact of the Matching Adjustment (referred to as MA) and the Transitional Measure on Technical Provisions (referred to as TMTP) on the solvency of firms. The total impact of each is shown as the joint effect of the lowering of the Solvency Capital Requirement (SCR) as well as the increase in the value of Eligible Own Funds (EOF).
| MA Decrease in SCR
|
IR.22.01.01.01R0050C0030
|
| MA Increase in EOF
|
IR.22.01.01.01R0050C0090
|
| TMTP Decrease in SCR
|
IR.22.01.01.01R0090C0030
|
| TMTP Increase in EOF |
IR.22.01.01.01R0090C0090 |
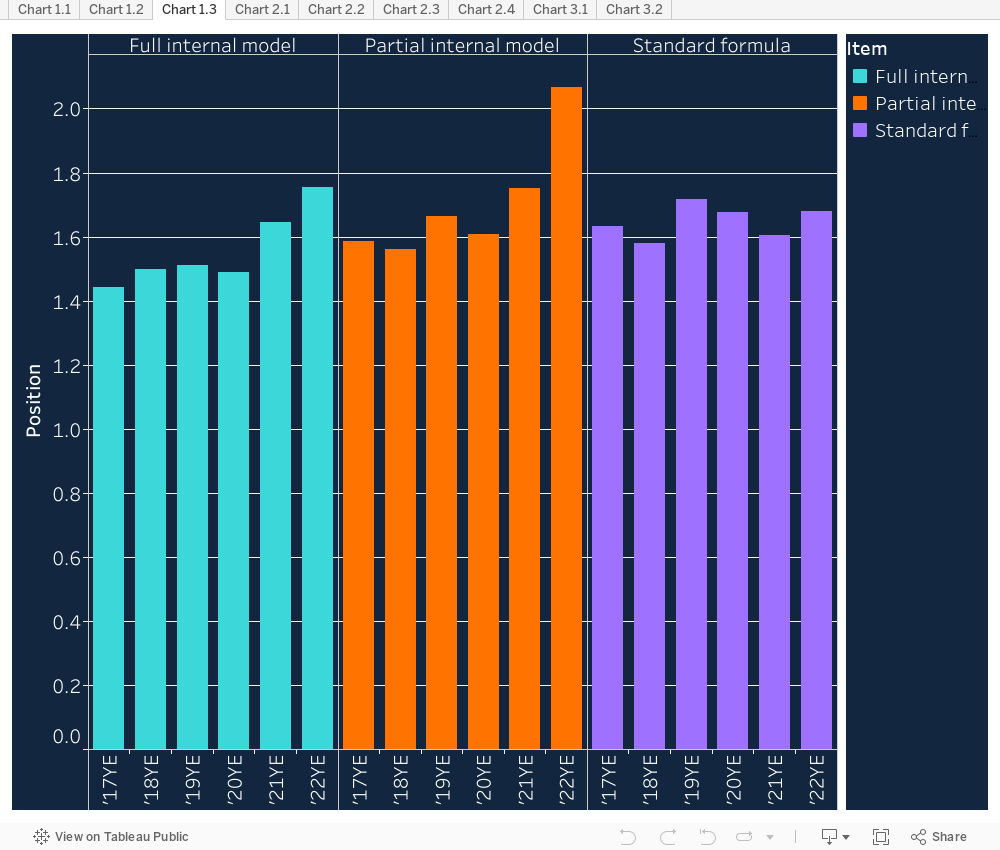
Chart 1.3 - Eligible Own Funds Ratio by Method of Calculation for the SCR
This chart shows the breakdown of Eligible Own Funds ratio, broken down by the method of calculation for the SCR.
| Method of Calculation for the SCR |
IR.01.02.07.01R0130C0010
IR.01.02.01.01R0130C0010 |
| Eligible Own Funds Ratio |
IR.23.01.07.01R0540C0010
IR.23.01.01.01R0540C0010
IR.23.01.07.01R0580C0010
IR.23.01.01.01R0580C0010 |
Section 2 – Non-life business
Premiums
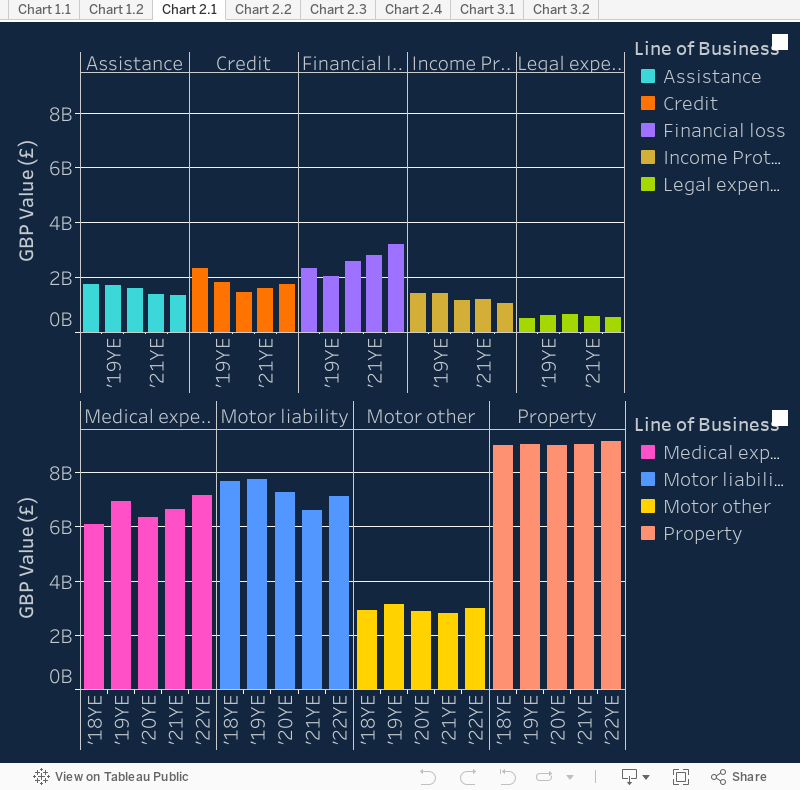
Chart 2.1 – Gross written premiums by personal lines
This chart shows gross written premiums for the non-life insurance sector and how it has changed over time. The breakdown is by personal lines of business.
| Assistance
|
IR.05.04.01.01R0110C0110
|
| Credit & Suretyship
|
IR.05.04.01.01R0110C0120
|
| Income Protection
|
IR.05.04.01.01R0110C0140
|
| Legal Expenses
|
IR.05.04.01.01R0110C0150
|
| Medical Expenses
|
IR.05.04.01.01R0110C0170
|
| Miscellaneous Financial Loss
|
IR.05.04.01.01R0110C0230
|
| Motor Vehicle Liability
|
IR.05.04.01.01R0110C0240
|
| Motor Vehicle Other
|
IR.05.04.01.01R0110C0250
|
| Property
|
IR.05.04.01.01R0110C0260
|
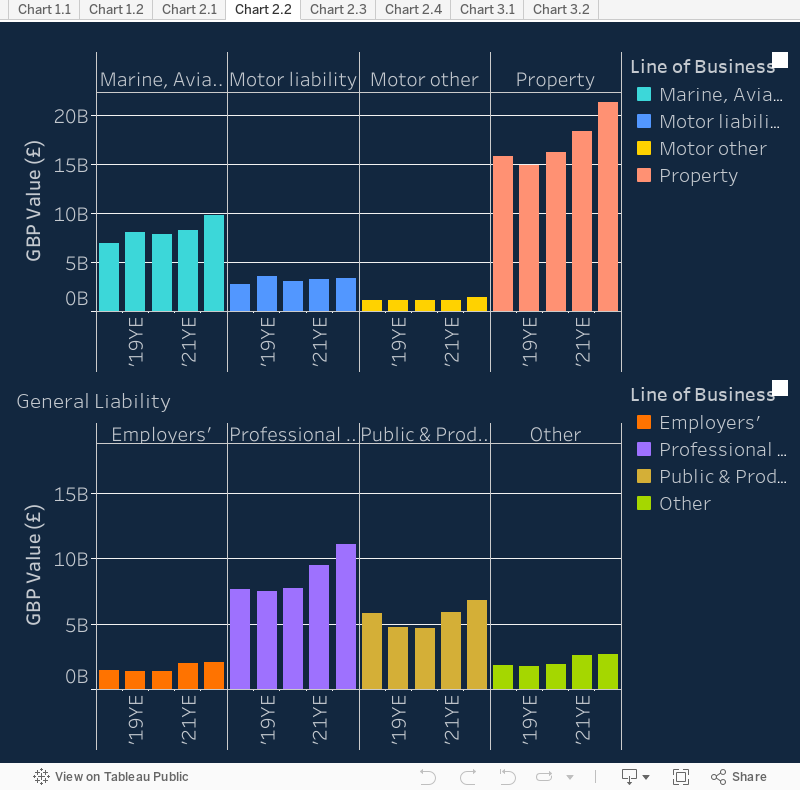
Chart 2.2 – Gross written premiums by commercial lines
This chart shows gross written premiums for the non-life insurance sector and how it has changed over time. The breakdown is by commercial lines of business.
| Marine, Aviation and Transport |
IR.05.04.01.01R0110C0141 |
| Motor Vehicle Liability |
IR.05.04.01.01R0110C0151 |
| Motor Vehicle Other |
IR.05.04.01.01R0110C0160 |
| Property |
IR.05.04.01.01R0110C0180 |
| Employers Liability |
IR.05.04.01.01R0110C0190 |
| Professional Indemnity Liability |
IR.05.04.01.01R0110C0200 |
| Public & Products Liability |
IR.05.04.01.01R0110C0210 |
| Other General Liability |
IR.05.04.01.01R0110C0130 + IR.05.04.01.01R0110C0220 |
Claims development
These charts, taken from data in IR.19.01, show the development of net claims paid for non-life insurance during the years following the initial accident/underwriting year, split by various lines of business:
• Assistance
• Financial loss
• General liability (plus Workers Compensation)
• Legal expenses
• Marine, aviation and transport
• Medical expenses
• Motor vehicle liability
• Other motor vehicle
• Property
• TOTAL
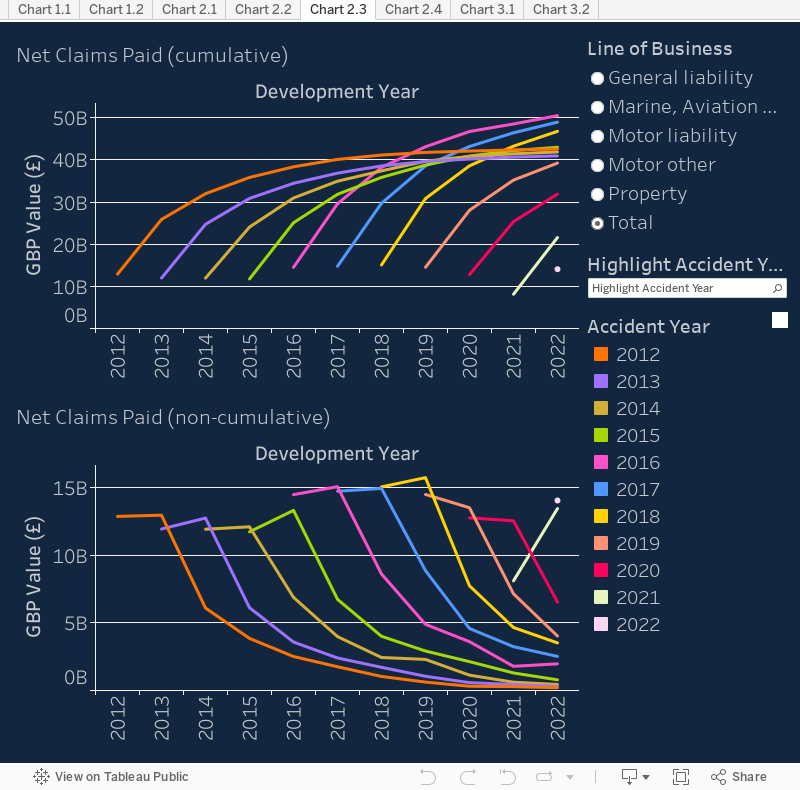
Chart 2.3 – Claims development by accident/underwriting year
These charts show the development over time of net claims paid on both a cumulative and non-cumulative basis.
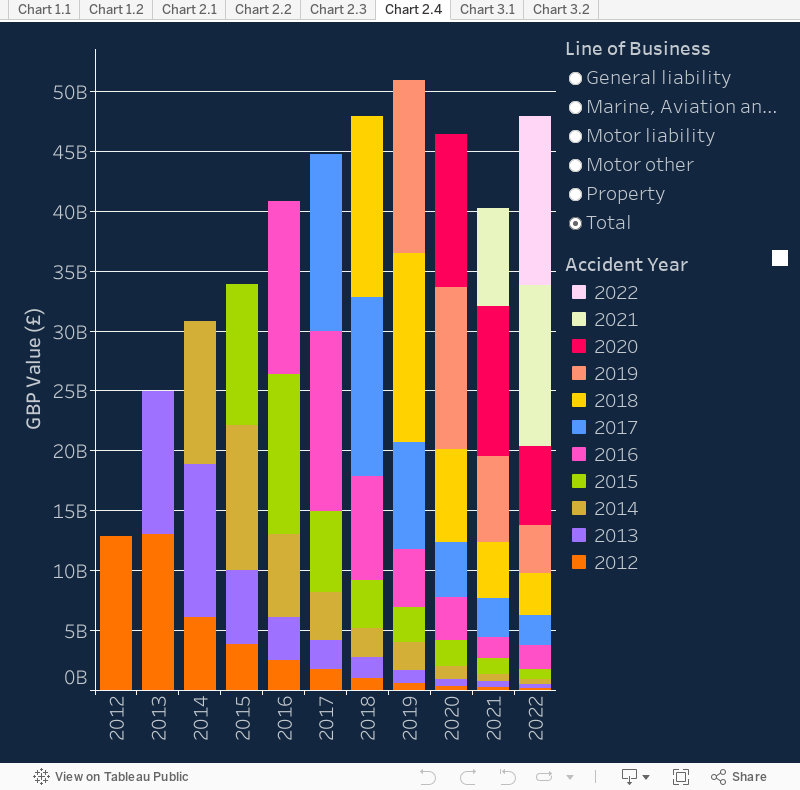
Chart 2.4 – Total net claims paid per development year
This chart shows the total net claims paid in a given year, split by the accident/underwriting year.
| |
|
0 |
1 |
2 |
3 |
4 |
5 |
6 |
7 |
8 |
9 |
10 |
| |
|
C1200 |
C1210 |
C1220 |
C1230 |
C1240 |
C1250 |
C1260 |
C1270 |
C1280 |
C1290 |
C1300 |
| Prior |
R0500
|
X |
X |
X |
X |
X |
X |
X |
X |
X |
X |
X |
| N-14 |
R0510 |
|
|
|
|
|
|
|
|
|
|
|
| N-13 |
R0520 |
|
|
|
|
|
|
|
|
|
|
|
| N-12 |
R0530 |
|
|
|
|
|
|
|
|
|
|
|
| N-11 |
R0540 |
|
|
|
|
|
|
|
|
|
|
|
| N-10 |
R0550 |
|
|
|
|
|
|
|
|
|
|
|
| N-9 |
R0560 |
|
|
|
|
|
|
|
|
|
|
X |
| N-8 |
R0570 |
|
|
|
|
|
|
|
|
|
X |
X |
| N-7 |
R0580 |
|
|
|
|
|
|
|
|
X |
X |
X |
| N-6 |
R0590 |
|
|
|
|
|
|
|
X |
X |
X |
X |
| N-5 |
R0600 |
|
|
|
|
|
|
X |
X |
X |
X |
X |
| N-4 |
R0610 |
|
|
|
|
|
X |
X |
X |
X |
X |
X |
| N-3 |
R0620 |
|
|
|
|
X |
X |
X |
X |
X |
X |
X |
| N-2 |
R0630 |
|
|
|
X |
X |
X |
X |
X |
X |
X |
X |
| N-1 |
R0640 |
|
|
X |
X |
X |
X |
X |
X |
X |
X |
X |
| N |
R0650 |
|
X |
X |
X |
X |
X |
X |
X |
X |
X |
X |
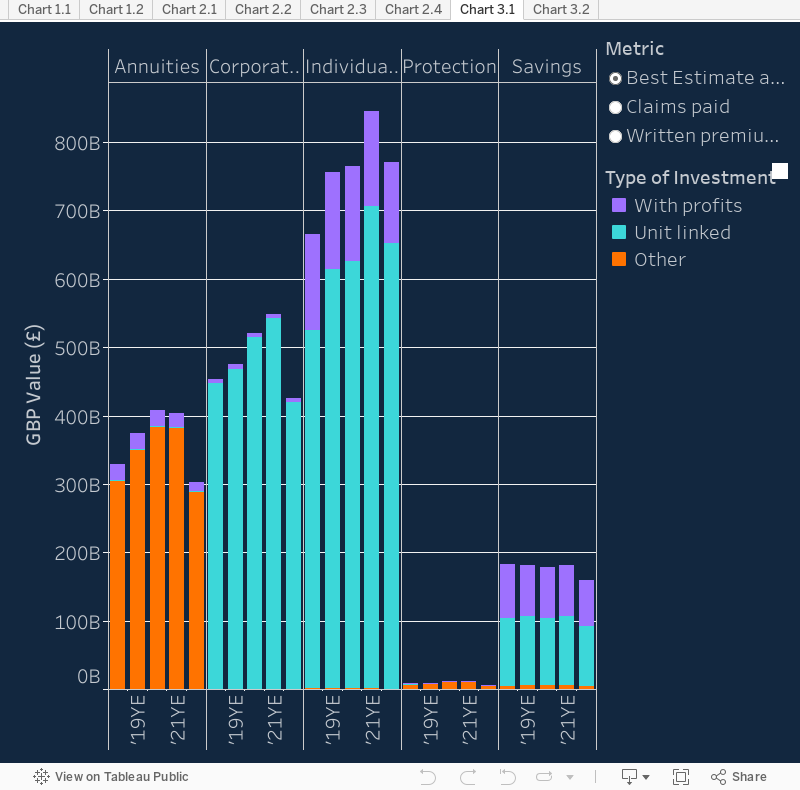
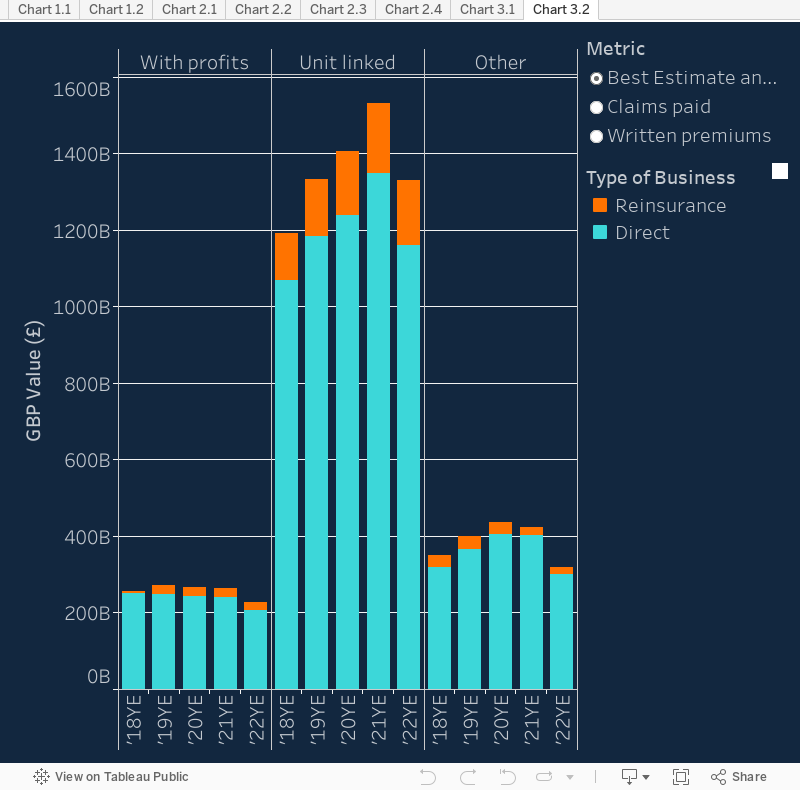
Section 3 – Life business
These charts show various breakdowns of life obligations using item-by-item data submitted in IR.14.01. The metrics included are split by line of business, type of investment, and type of business. The detailed lines of business included in each broad line of business shown in the chart can be seen in the table published in the appendix of SS36/15.
Chart 3.1 – Lines of business
This chart shows each line of business broken down by investment type for direct business only.
Chart 3.2 – Types of Investment
This chart shows the types of investment split between direct and reinsurance business.
| Product ID code "mandatory" |
IR.14.01.01.01 (C0010) |
| Line of business |
IR.14.01.01.01 (C0030) |
| Number of contracts at end of year |
IR.14.01.01.01 (C0040) |
| Number of new contracts during year |
IR.14.01.01.01 (C0050) |
| Written premiums |
IR.14.01.01.01 (C0060GBP) |
| Claims paid |
IR.14.01.01.01 (C0070GBP) |
| Best estimate |
IR.14.01.01.01 (C0180) |
| Best estimate |
IR.14.01.01.01 (C0060GBP) |
| Capital at risk |
IR.14.01.01.01 (C0190) |
| Capital at risk |
IR.14.01.01.01 (C0070GBP) |